(DENVER) – The Occupational Employment and Wage Statistics (OEWS) program is a Federal-State cooperative program that provides estimates of employment and wages for over 800 non-military detailed occupations in 22 major occupational groups. Every year, the Colorado Department of Labor and Employment, in partnership with the Bureau of Labor Statistics (BLS), collects and publishes occupation and wage data for the State of Colorado and for ten substate regions: seven Metropolitan Statistical Areas (MSAs) and three Balance of State (BOS) Areas. For information regarding the effects of the COVID-19 pandemic on OEWS data, see BLS OEWS effects of COVID-19 on OEWS data.
Statewide Highlights
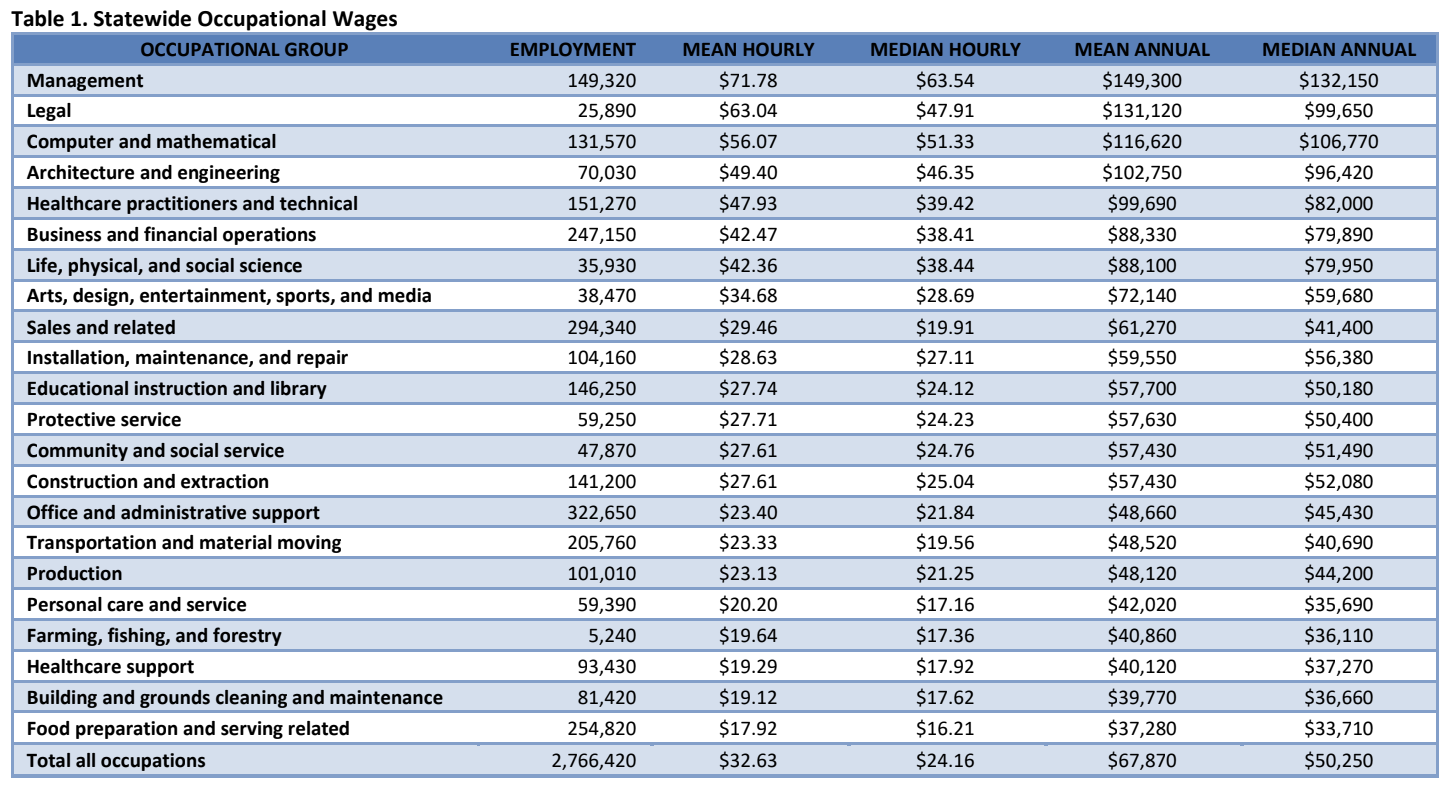
Workers in the State of Colorado had a mean (average) hourly wage of $32.63 in 2022, about 9.6 percent above the US average of $29.76, according to the Colorado Department of Labor and Employment and the US Bureau of Labor Statistics. The statewide median hourly wage for all covered employment was $24.16 compared to the US median of $22.26.
Statewide Occupational Employment and Wages
The occupational groups with the most workers were office and administrative support (322,650 workers), sales and related (294,340), and food preparation and serving related occupations (254,820). These three groups accounted for just under 32 percent of total covered employment. Management occupations had the highest average wage, while food preparation and serving related occupations had the lowest (see Table 1).
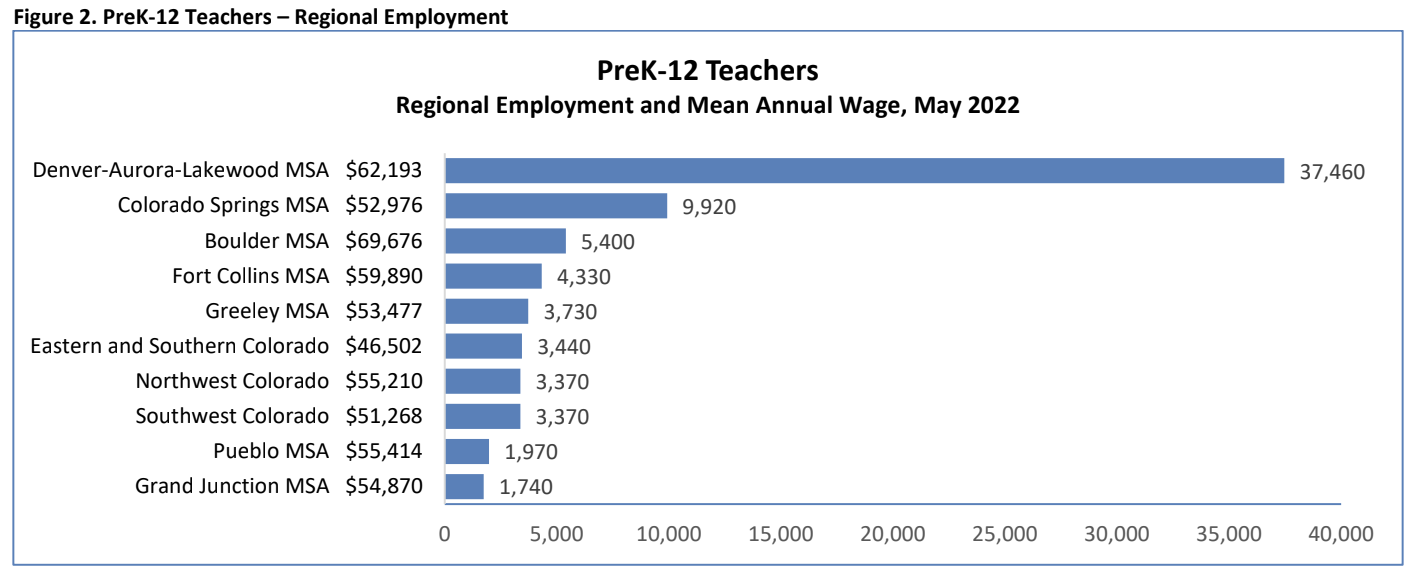
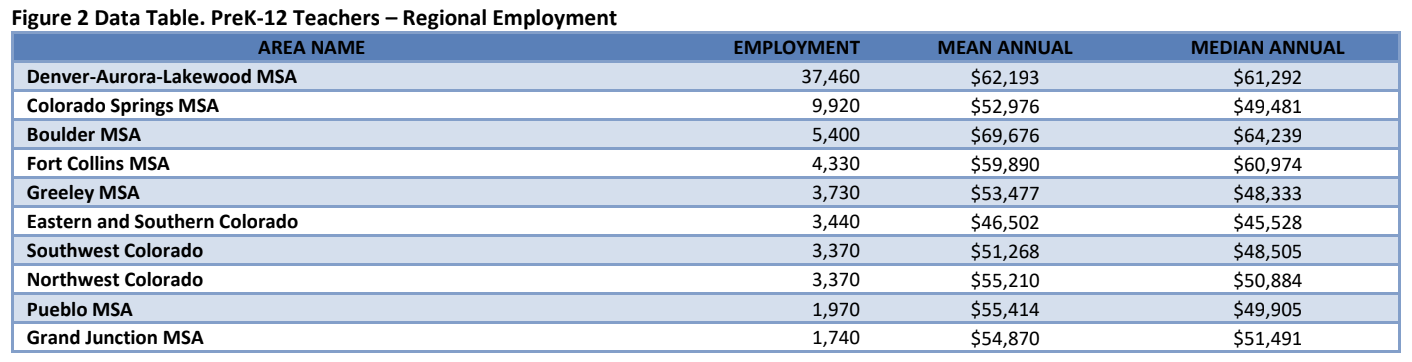
Regional Occupational Employment
The most common occupations statewide were retail salespersons (80,000 workers), fast food and counter workers (75,490), and registered nurses (52,390), and these were also among the top three occupations in most of the substate areas (see Table 2).
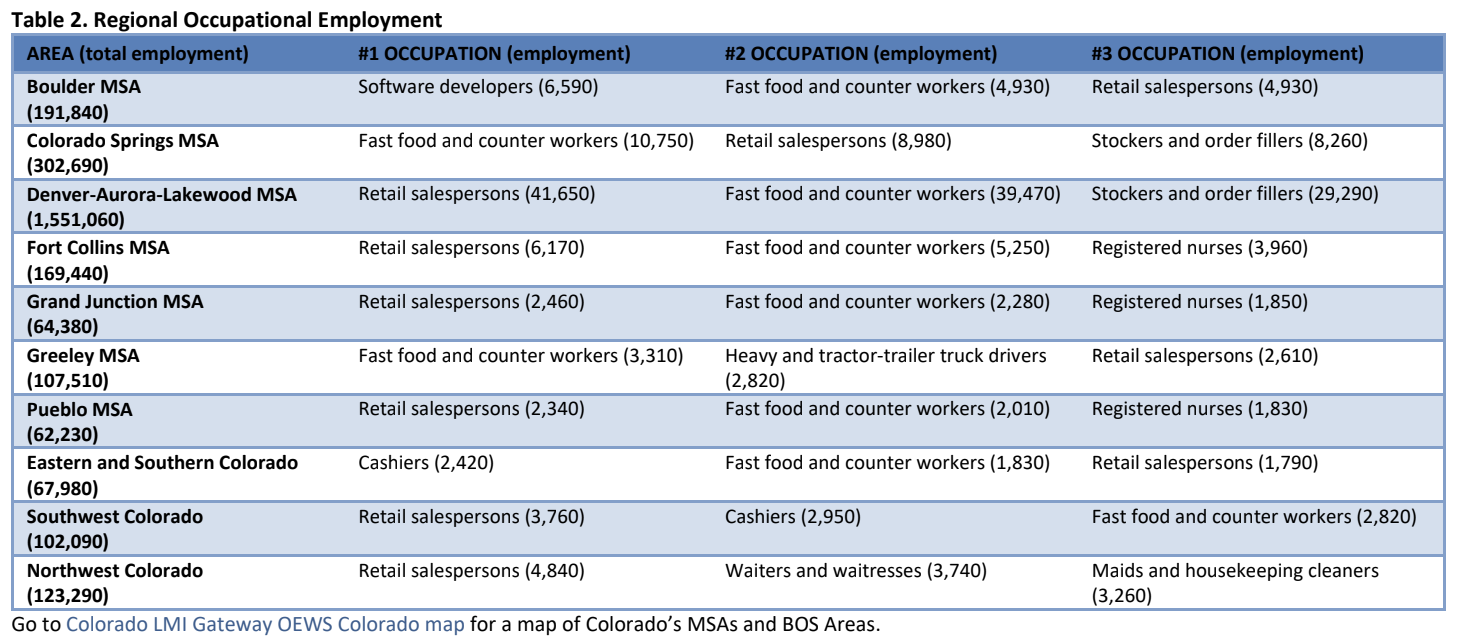
Go to Colorado LMI Gateway OEWS Colorado map for a map of Colorado’s MSAs and BOS Areas.
Regional Occupational Wages
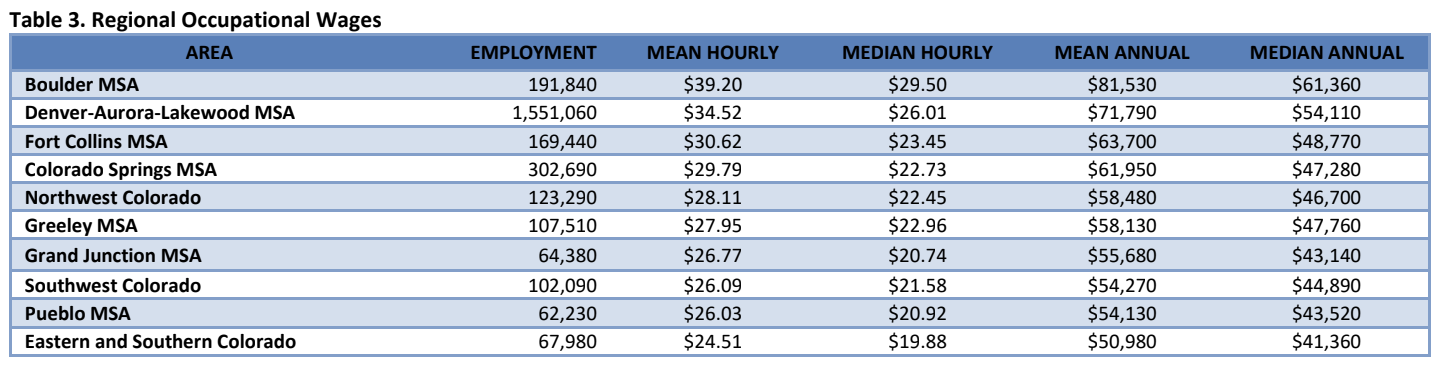
The Boulder MSA had the highest overall average and median wages and the Eastern & Southern Colorado BOS Area had the lowest (see Table 3). Both Boulder and Denver had average and median wages that are higher than the statewide average and median (see Table 1).
Statewide Location Quotients (LQs)
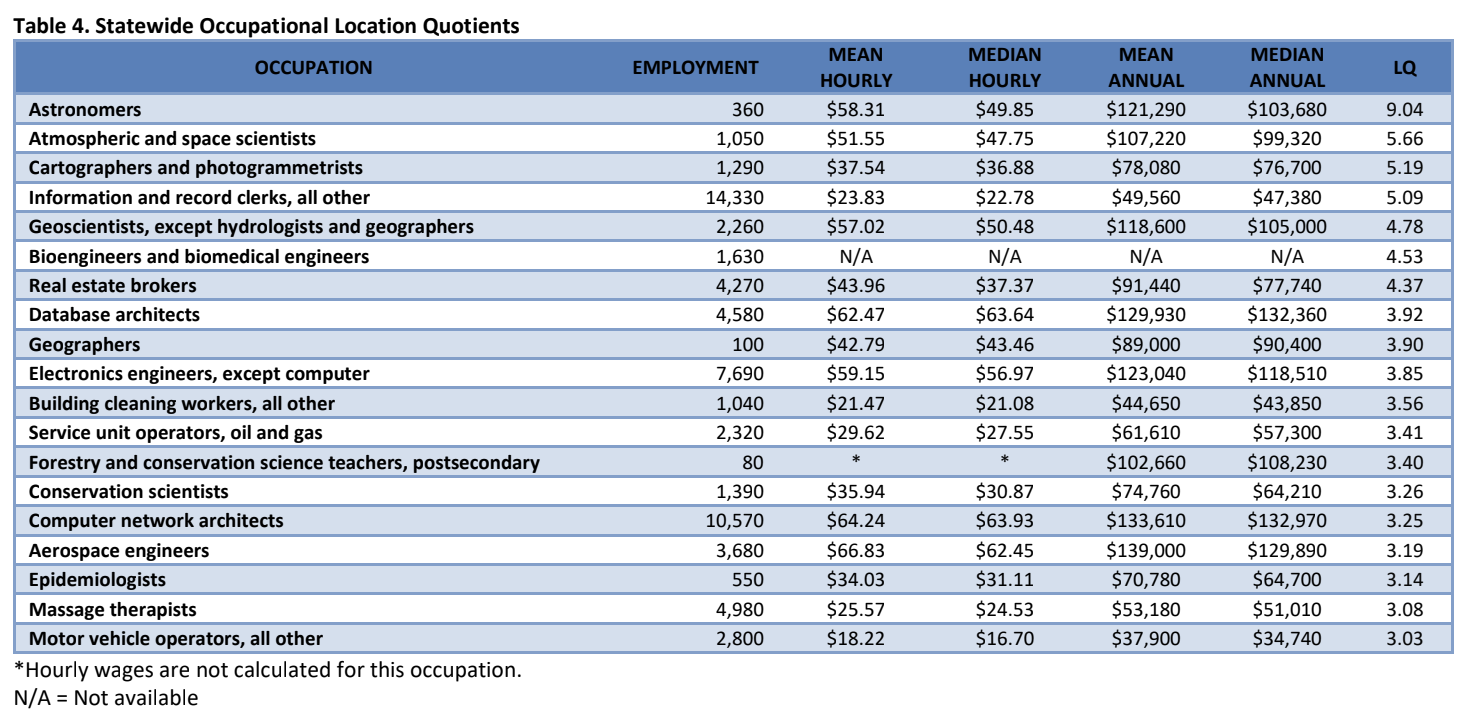
A location quotient allows us to explore the occupational make-up of a state, MSA, or BOS Area by comparing the composition of jobs in an area relative to the national average. For example, an LQ of 2.0 indicates that an occupation accounts for twice the share of employment in an area than it does nationally. Compared to the US, Colorado demonstrated a higher share of employment in architecture and engineering (LQ of 1.51), life, physical, and social science (1.46), computer and mathematical (1.41), business and financial operations (1.37), and construction and extraction (1.24) occupations and a lower share of employment in farming, fishing, and forestry (0.61), production (0.62), healthcare support (0.74), transportation and material moving (0.81), and management (0.81) occupations. See Table 4 for detailed occupations with the highest LQs.
Regional Location Quotients (LQs)
The occupations with the highest concentrations of employment in each substate area were astronomers in the Boulder MSA (LQ of 90.75), religious workers, all other in the Colorado Springs MSA (11.93), geoscientists in the Denver-Aurora-Lakewood MSA (7.26), forestry and conservation science teachers, postsecondary in the Fort Collins MSA (47.74), service unit operators, oil and gas in the Grand Junction MSA (17.04) and in the Greeley MSA (45.91), cardiologists in the Pueblo MSA (8.20), graders and sorters, agricultural products in the Eastern & Southern Colorado BOS Area (15.47), rock splitters, quarry in the Southwest Colorado BOS Area (11.74), and loading and moving machine operators, underground mining in the Northwest Colorado BOS Area (14.64). More location quotients are available at Colorado LMI Gateway (Products & Resources: Data OR Data Trends > Employment and Wage Data > Occupation Data: LMI Gateway Related Items).
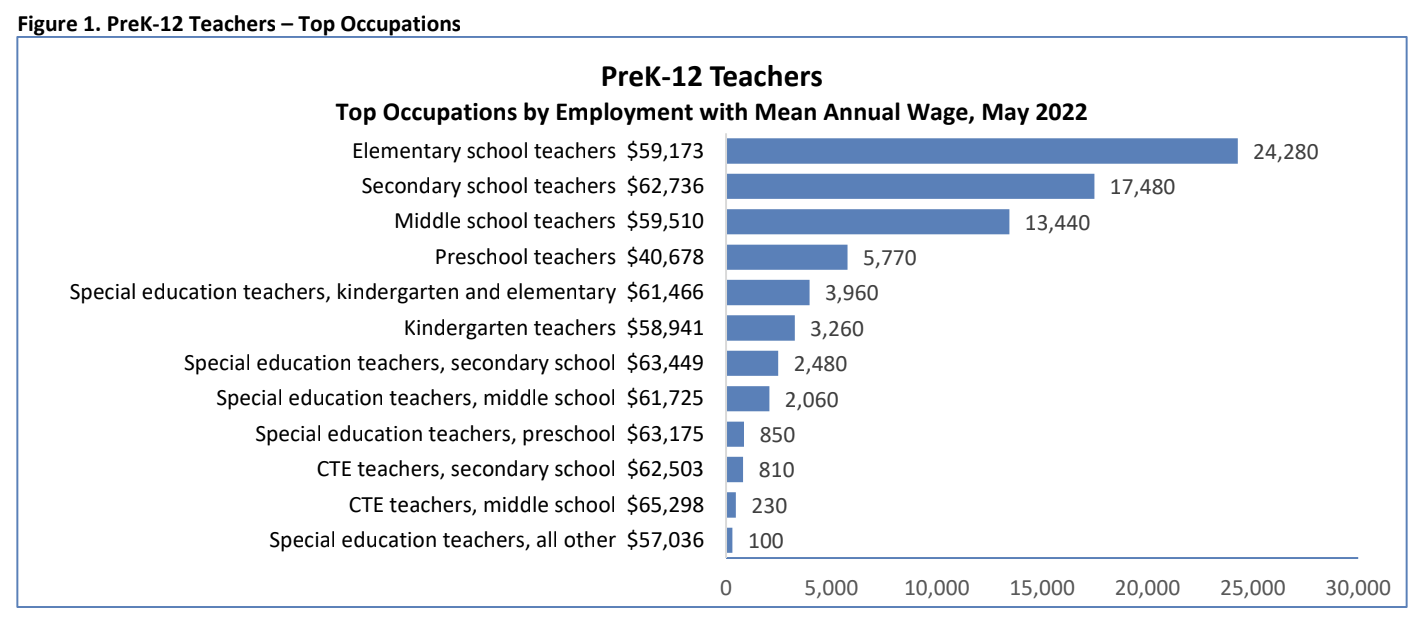
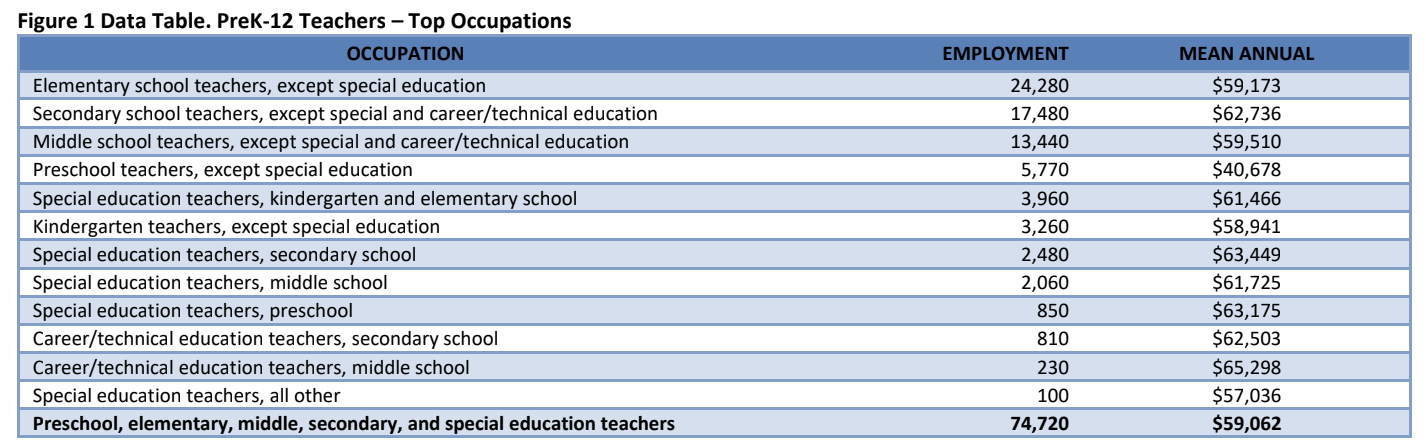
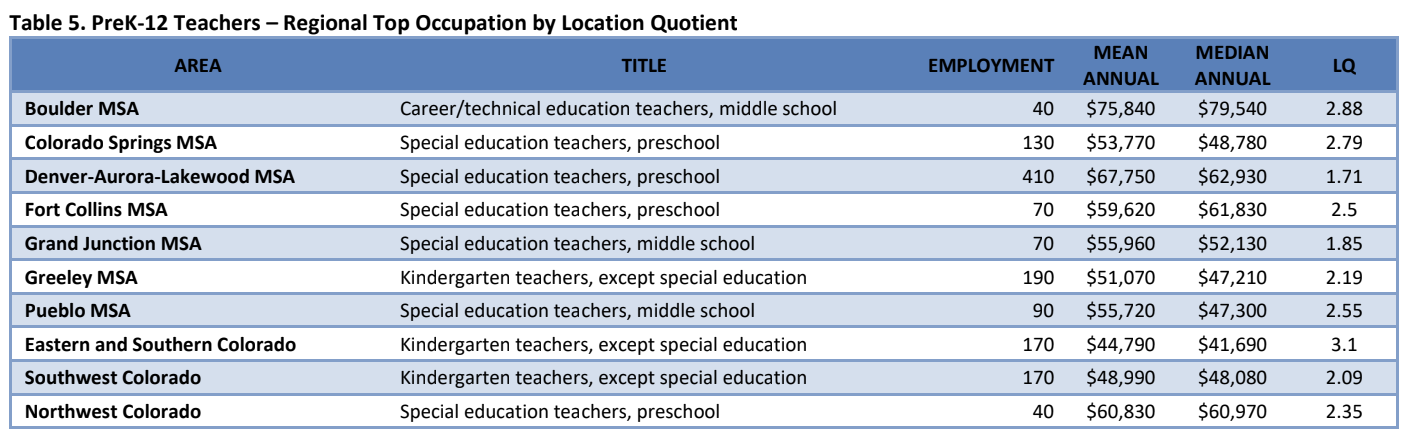
Spotlight on: PreK-12 Teachers
Preschool through secondary school (high school) teachers include regular classroom teachers as well as those who work in special education and career and technical education (CTE). There were 74,720 workers employed in this group in Colorado in 2022, with an average annual wage of $59,062 and a median annual wage of $58,819.
The Colorado Occupational Employment and Wage Statistics Survey
In Colorado, 3,915 businesses were initially surveyed beginning in November of 2021 and 3,893 were initially surveyed beginning in May of 2022. After excluding establishments that were out of business or out of scope, a total of 83.0 percent of 7,398 businesses provided information on the job titles and wages of their employees. These data were combined with responses from the previous two years (four biannual surveys) to produce the May 2022 occupational estimates highlighted in this document.
OEWS data are available from BLS at BLS OEWS data and on the CDLE LMI website at Colorado LMI Gateway (Products & Resources: Data OR Data Trends > Employment and Wage Data > Occupation Data: LMI Gateway Related Items). Industry-specific data (NAICS Sector and 3- and 4-digit, Excel files) are available at BLS OEWS research estimates.
###
Technical Note
The OEWS survey is a semiannual survey measuring occupational employment and wage rates for wage and salary workers in nonfarm establishments in the United States. The OEWS data available from BLS include:
- cross-industry occupational employment and wage estimates for the nation and for over 580 areas, including states and the District of Columbia, MSAs, nonmetropolitan areas, and territories;
- national industry-specific estimates at the North American Industrial Classification System (NAICS) sector, 3-digit, most 4-digit, and selected 5- and 6-digit industry levels; and
- national estimates by ownership across all industries and for schools and hospitals.
OEWS data are available at BLS OEWS data.
OEWS estimates are constructed from a sample of about 1.1 million establishments. Each year, two semiannual panels of approximately 179,000 to 187,000 sampled establishments are contacted, one panel in May and the other in November. Responses are obtained by Internet or other electronic means, mail, email, telephone, or personal visit. The May 2022 estimates are based on responses from six semiannual panels collected over a 3-year period: May 2022, November 2021, May 2021, November 2020, May 2020, and November 2019. The unweighted sampled employment of 80 million across all six semiannual panels represents approximately 57 percent of total national employment. The overall national response rate for the six panels, based on the 50 states and the District of Columbia, is 65.4 percent based on establishments and 62.5 percent based on weighted sampled employment.
For more information about OEWS concepts and methodology, go to BLS OEWS technical notes.
May 2022 OEWS data are available for most 2018 Standard Occupational Classification (SOC) detailed occupations. To improve data quality, the OEWS program has replaced some 2018 SOC detailed occupations with SOC broad occupations or OEWS-specific aggregations. Information about the SOC system is available on the BLS website at BLS SOC information and information about the NAICS system is available at BLS NAICS information.
New estimation methodology
Starting with the May 2021 estimates, the OEWS program implemented a new estimation method. This new model-based method, called MB3, has advantages over the previous estimation method, as described in the Monthly Labor Review article “Model-Based Estimates for the Occupational Employment Statistics program.” Technical information is available in the Survey Methods and Reliability Statement for the May 2022 OEWS Survey.
Substate area definitions
The substate area data published in this release reflect the standards and definitions established by the US Office of Management and Budget.
Additional information
Answers to frequently asked questions about OEWS, including uses of OEWS data, are available at BLS OEWS FAQs.